
In this article we will take a closer look at trailing stop loss – what it is, how to use it. You can easily use this with others trading tools or based your whole trading plan around it. We will see how to do it.
This is more advanced material – I assume that you have some knowledge what price action is, how to use averages or oscillators. Anyway, I try to keep things simple.
THIS GUIDE WAS PUBLISHED ON MARKETSURVIVAL.NET. DON’T SCRAP AND STEAL MY CONTENT. ALL RIGHTS RESERVED.
MATERIALS – YOUR TRADING TOOLS
In my trading toolbox you can find indicators and templates which I use in my trading. Template names start with atr_. If there will be a problem with installation, let me now.
TRAILING STOP LOSS – WHAT IS IT
Trailing stop is a very good tool, when you have problem with closing positions. It is presented as a line which is away from current price. For a long position this line is below price and for short position it is above price. The distance between stop line and price is based on ATR indicator.
The biggest advantage of trailing stop loss is that it takes away emotions from closing positions. We are talking here about two kinds of situations:
- your position is in profit – you want to close it but profit may be even bigger. Because of your greed you can’t make a good decision
- your position is in minus – you are in stress because you are losing money.
You know that feeling when you know you should be out right now and move on, but something is telling you “maybe it will back”.
With trailing stop loss line it is more clearer to you. It is kind of mechanical trading – when you have long position and price moves below line then it is time to close. No second guessing.
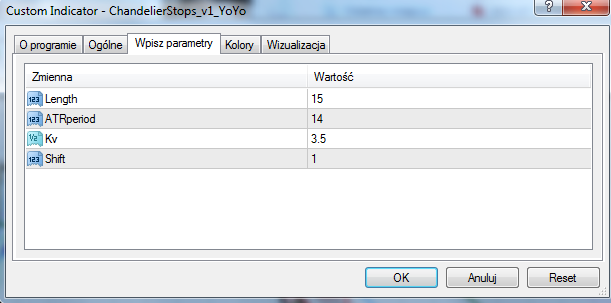
BEST PARAMETERS FOR ATR TRAILING STOP LOSS
This is very confusing for new traders. You can see on many forums questions about best parameteres for trailing stop loss. Short answer is – there is no such a thing. Each instrument behaves different, even each Forex pair acts different. So what can you do? You simply change settings for current instrument based on history price action. You can see what settings worked best in the past. In my case I have basic settings for Forex and anoter one for stocks. If there is a need (I see it is not working so great), I change it for current instrument.
Most often thoe – I stick with basic parameters (Kv 3.5 or 4.0, based on chart history).
Two things to remember about:
– if you use wide trailing stop loss it may look that it is great for catching big trends:
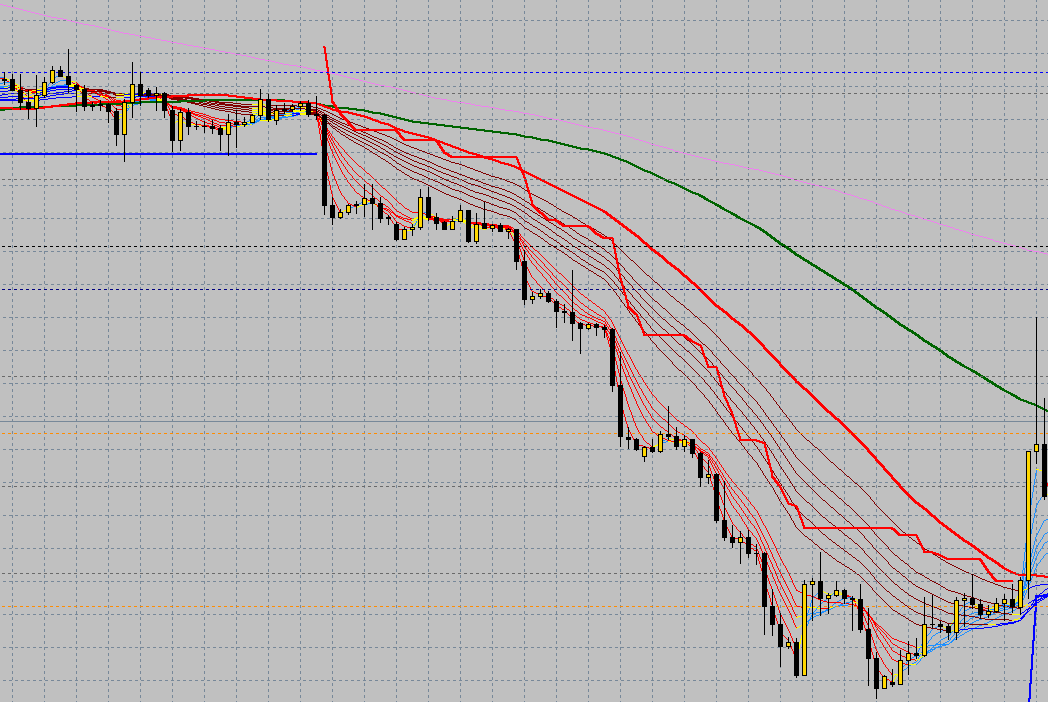
Remember that with big space between price and stop line your stop loss will be very big (so your possible loss may be very big):

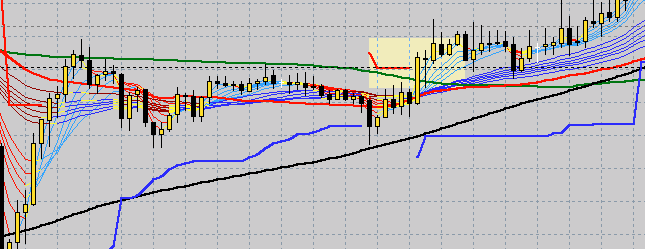
– if you place trailing stop loss too close to the price then you will be stopped out to often:

Like in life, the solution is somewhere in the middle. You should check price history to see which settings worked best in the past.
WHICH TRAILING STOP LOSS SHOULD YOU USE?
There are few types of trailing stop loss, but in Metatrader4 I use Chandelier Stops (sometimes called Chandelier Exits) popularized by Chuck LeBeau.
Tip: if you are using Ichimoku, take a closer look at Kijun-Sen line. This line alone may work well as trailing stop loss. That is why I like Ichimoku – this is only one of components of Ichi and alone it is still powerfull.
PREFLIGHT CHECKLIST – THINGS TO CHECK BEFORE TRADE
ATR isn’t some magical tool which will work great 100% times. Before placing a trade, you should check if conditions are met.
In your preflight checklist should be things like:
– verification of trend on higher time frames
The most important thing is the higher time frame.
Scenario: you are on 15-min chart and based on your signals you want to go short. Price closed below stop line so you are good to go. But… on higher time frames trend is up. You decided to go short. The chances are that you will be stopped out.
You should have confirmation from higher time frames that you are opening trade in a trend direction from higher time frame.
– make sure that price is not in a range move (not always easy or possible, but it is somethign you should try to check)
With ATR you can loose a lot of money in range move, because you will be stopped out often. That is why you should try to avoid range moves.
– check support, resistance lines, pivot lines
You do not want to open a long trade right below resistance line, it is clear.
– check other criteria from your trading plan
For example you may have in your entry plan condtions that price should be above 100 and 200 averages, MACD should be positivie etc.
I prefer to add some basics moving averages, thanks to that it is easier to decide if position can be opened.
HOW TO TRADE WITH TRAILING STOP LOSS
Concept is simple – when price is above trailing stop line, you are long. When price was above trailing stop and closes below it, you go short. In practice that can generate many false signals, so it is best to combine ATR with other tools like GMMA and Pivot points.
HOW TO TRADE – TRAILING STOP AND GMMA
This is my favorite combination. We have here on chart:
– gmma lines
– 50, 100 and 200 simple moving averages
– ATR Trailing stop loss (Chandelier Stops)
GMMA lines are simple to use. They are build from two parts: short term averages group and long term averages group. When short term is above long term group, bulls are in control. If you are totally new to this concept, watch some videos on youtube – it will be all clear.
We have also most standard averages, that is: 50, 100 and 200 SMA. Why them? They are most popular and most traders are checking them. Also, they work great as support resistance levels.
Finally, we have our trailing stop loss lines. Lets check how they work together on examples.
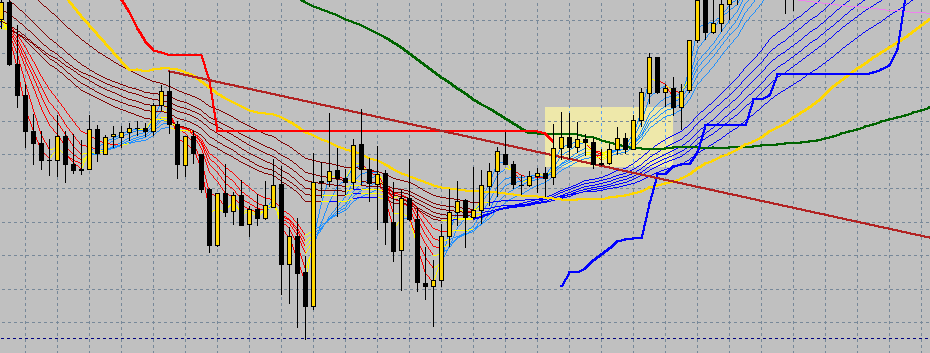
Below we can see some false signals to enter short and long (when price crosses ATR line). But when we check bigger picture, it is clear that price is trapped between 100 SMA (green) and 200 SMA (black):
Some time after that price managed to break above 100 average. I marked that with light rectangle. In that moment we can see that:
– gmma is positive (short term group is above long term group)
– price is above 50, 100 and 200 SMA
– price is above trailing stop loss (blue)
From that moment we can watch for trailing stop loss as our exit point.
The size of gap between averages
When price is below 200 average and I have signal to go long then I check the gap between 100 and 200 averages. If gap is small, then I wait for break above 200 average. Sometimes gap is wide like in the example below (over 200 pips wide). Then I can go long, but I will close portion of my position at 200 SMA. This is 30 min chart of gbp/jpy:
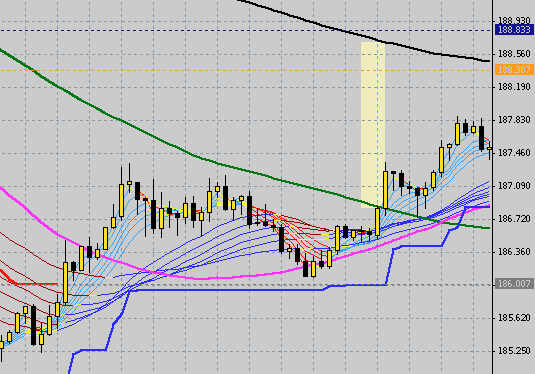
Lets say that I entered long around 187.0. It was easy to spot because of break above 100 average and break above resistance (from previous highs). Still same pair and time frame:

You can see that with trailing stop loss we stayed long until 191 level, so something like 400 pips of profit. Pretty nice, if you ask me.
Yes, it is not often that easy. But even when it is easy (because trend is strong), you still do not know where to close position and take profit. Thanks to trailing stop loss – you do.
Sometimes you may be stopped out several times before you catch bigger trend. That’s life.
As I wrote before, higher time frames are very important. With GMMA you can easily check how situation looks like on higher time frames.
GMMA, trend lines and trailing stop loss, eur/usd 30min chart.
You can easily spot the green support line. The main trend is down and we saw here a correction up to the 100 average (green). From that point bears were back. Best moment to enter short position was after break below green support line. Right after that we could watch ATR stop line as our guide. You can see that after that we saw some strong continuation of move down:

Another example, GMMA, trend lines and trailing stop loss, eurusd 30min chart.
Main trend is up, there was a correction down. You can see a trend line and resistance line (green ones). Signal from ATR stop loss came early, but it was best to wait for break above trend lines and 50 moving average (violet). After that there was a nice continuation of move up:

GMMA, trend lines and trailing stop loss, usd/jpy, 30min chart.
Same as before, signal from ATR to go long came earlier, but price was still below moving averages and below trendline (dark red). Finally, price broke up above that levels and with light rectangle I marked area where you could try to enter long position:
HOW TO TRADE – TRAILING STOP AND PIVOT POINTS
If you read blog for a longer time, you know that I always check pivot points. Pivots are based on time frame, so we can have hourly, 4-hour, daily, weekly, monthly pivots etc. Question is – which should you use? Because when you put them together it will be a mess. So in short this is how I use them:
- lowest time frames (1 minutes, x seconds) – I would check for hourly, 4-hour and daily pivot lines. I do not trade that low anymore.
- time frames between 1 minute and 30 minutes – I check for daily pivot points, in the backgroud I also watch for weekly and monthly, but my focus is on daily pivots
- time frames between 30 minutes and daily – I check weekly and monthly pivots
- time frames daily and higher – I check mostly monthly pivots
It may sound complicated, but it isn’t. When you start to use pivots in your trading, you will soon get which are best for current time frame.
Why I like pivot points?
First of all – they work. Traders around the world watch for them as possible support/resistance levels. I wrote support because you can’t be sure if price will stop at R2 or S2 line. But this levels are still posible targets. This is a valuable information, so you can include it in your trading plan. We are using ATR trailing stop loss, but with pivots and averages we have a clearer picture where we are.
Which pivots and time frames I use most often? When it comes to ATR trailing stop – 30 minutes and 1 hour time frames, I watch for weekly and monthly pivots. They give us a good possible reversal targets.
TRAILING STOP AND PIVOT POINTS – EXAMPLES
OK, now when we know why pivots are great, let’s check some examples of trades. You may notice that trades are not always based on ATR. Look at this like that way: you check first for condition to open long or short trade (you check higher time frames, pivots, moving averages…). If conditions are right and you have signal from ATR – you go with a trade. If you see a signal from ATR, but conditions are not met, you pass. Thanks to that you are increasing your chances of success and you will be stopped out less often.
60 min. eur/usd – trailing stop loss, GMMA, basic averages (50, 100, 200), pivot points

Situation: eur/usd is below pivot points, we have confirmation that trend is down.
First trade: We saw a valid signal from ATR to go short, but we were stopped out few hours later.
Next we saw a signal to go long from ATR, but it was clear that this is a correction (price below averages) and we waited.
Second trade: another signal from ATR to go short. As you can see, trend got stronger and we saw a nice move down. Price stopped at weekly S2 and S3 levels, This were good points to close part of position and take profits.
You can see that we were stopped out by ATR the next day.
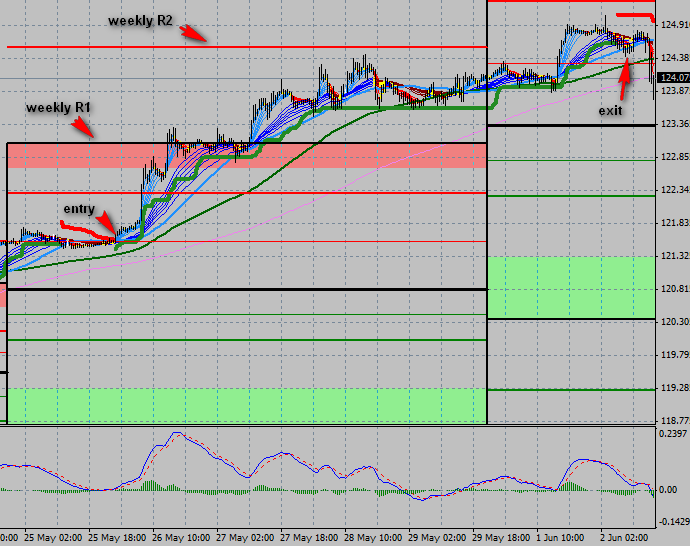
It is not always that easy with trends. Sometimes it look like trend is strong, but its run out of power very soon. Check example below. We have here 30 min eur/usd. Let’s analyze it step by step.
eur/usd, 30 min., trailing stop loss, GMMA, basic averages (50, 100, 200), pivot points
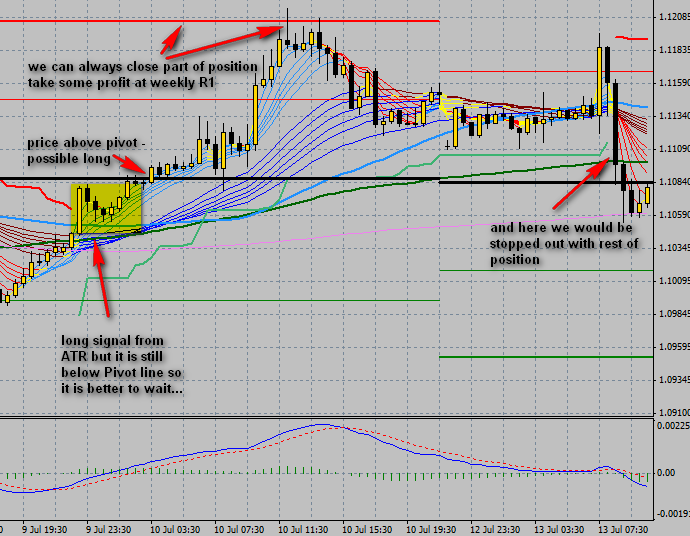
Situation: trend is down, but correction up is possible. Price is below weekly pivot line.
Trade: We have a signal from ATR to go long, but signal is false. Price is right below pivot line which may be a strong resistance and reversal point. That is why we wait to see if price will close above pivot line (other conditions are met – GMMA and MA lines are positive). You can see that finally price closes above pivot line and goes up. We watch ATR line as our stop line. Soon price is near R1 line. We can do here a partial close or just watch ATR line. I prefer partial closes, because thanks to them I book some profit. As you can see, R1 line is a top, after that we watch a reversal. In the example before it was best to wait for sell signall from ATR line, in this case it was better to do a partial close. As I said – I prefer partial close, because you never know which kind of move is that.
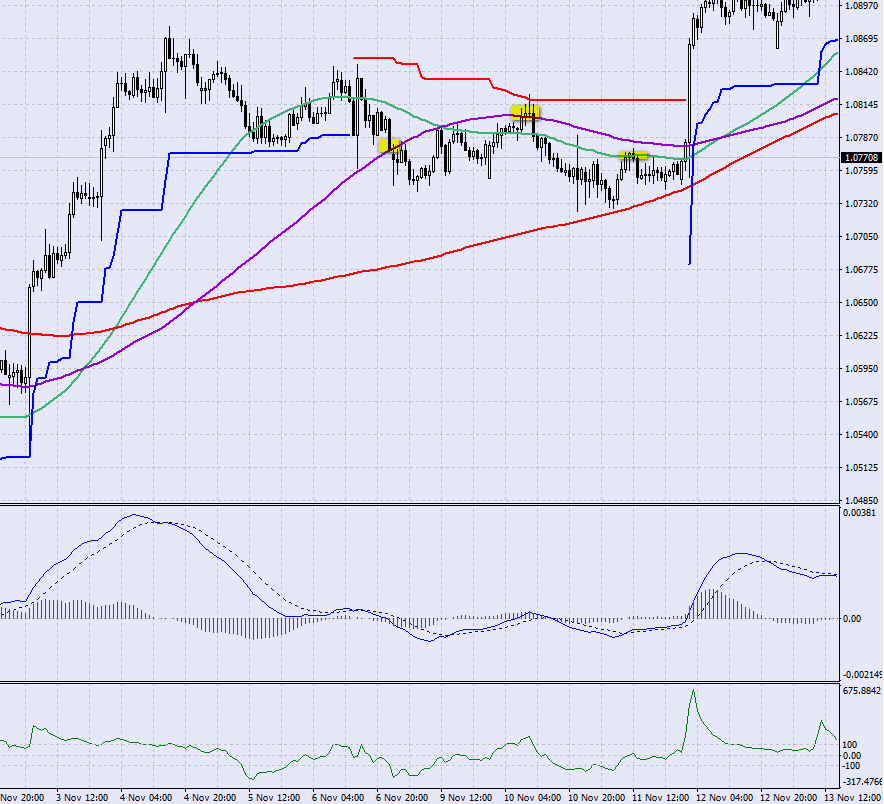
eur/usd, 30 min., trailing stop loss, GMMA, basic averages (50, 100, 200), pivot points
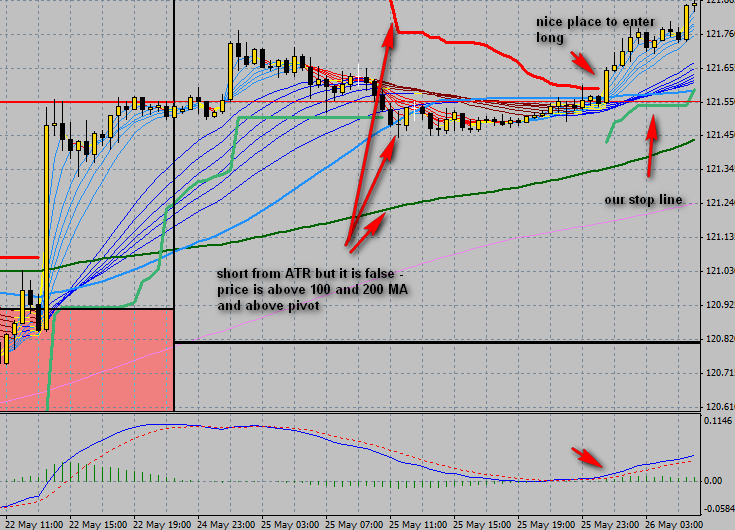
Situation: trend is up, but we see a move down and sell signal from ATR. This signal is false, because price is above pivot line and 100 MA (also MACD line is positive). We wait and after a while there is a signal to go long. This one was correct.
(continuation of a trade before): this was a strong move which lasted more than a day and gave a nice profit. Trade was stopped out the next day, with circa 300 pips profit. That is a good example how great trailing stop can work.
CHANDELIER EXITS IN STOCK MARKET AND LONG TERM TRADING
I focus mostly on shorter time frames in forex, but ATR works great if you are a long term trader. Some software has built-in ATR stop. For US market you can check http://www.stockcharts.com. When you open a chart, from options below you can add indicators. Select Chandelier Exits and click update button:

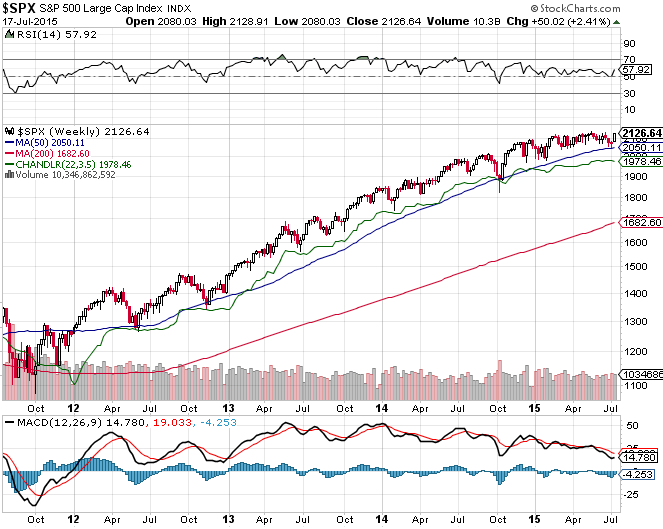
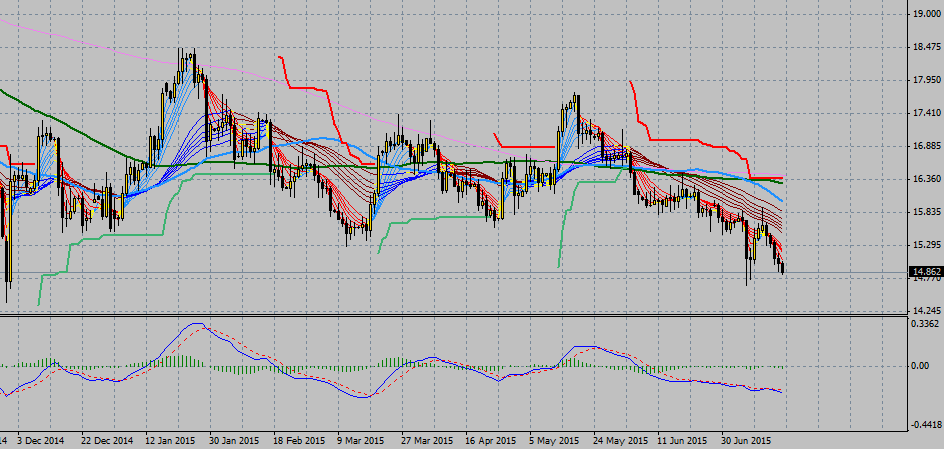
Let’s have a look at long term examples. These are weekly charts with ATR.
On this weekly Apple chart you can see, that signal to go long was below moving averages. It was best to wait for a clean close above them and then it was a good place to entry. In this example ATR line is set to 3.0 which is pretty close to the price. Thanks to the trailing stop you would be still in a position.

Weekly USO. Price was here for a long time in a range move. There were even fasle signals to go short and long. But in August 2014 there was a signal to go short, and thanks to that you could catch a nice move down.

Yes, SPX is in very strong uptrend so even with simple averages you could catch most of it. Point is, when trend is strong you should have a system in place to keep with trend. During last few years we saw some stronger corrections, but thanks to the Chandelier Exits we were able to stay in trend and profit. This is basic 3.5 settings on weekly chart and effects are great.
Sometimes you will get signal to go close position, but after a while trend will continue like in the example below. That is normal. You can always reenter previous trade.

MONEY MANAGEMENT – PARTIAL CLOSE
If you read my Fibonacci guide, you know that I prefer to close part of my position when trend is strong. That is something I learned on my bad trades – things may be great, but reversals can be very sudden and you will lost most of your potential profits. With pivot points (and Fibo extensions) I know where possible reversal points are. So when I am long and price hit R1 line I can close 1/3 of my position and leave the rest in the game. If price goes up, I close another 1/3 at R2 line. If price still goes up, I still make a profit because the other 1/3 left is in the game. I can close it at R3 line or after sell signal from ATR line.
It is up to you how you plan your trade. I learned that trend may be very strong and make you a lot of profit, but it can also be strong to the reversal point when things turn around in few seconds. That is why I got interested in pivot points and fibonacci extensions. These are only possible reveral po ints, but still it is a valuable information.
RANGE MOVES
It is not always that easy like in the examples above. Trailing stop allow you to profit from trends. When you catch one, you are good to go. Sometimes there is no trend in place and price is in a range move. You will get many signals to go long and short to be stopped out a moments later. Like in the chart below, on this daily chart silver is clearly in a range. Check how many signals from ATR we have:
Of course it is not always clear that price is in range and you will open position and take a loss. Important thing is not to overtrade in range market. You have to identify range and wait for breakout from range.
How to recognize range move? It is not simple and you can’t count on indicators. You should follow price action. If price fails to make a new low or new high then you should place horizontal lines on chart on previous AB move.
FALSE SIGNALS
How to avoid it? There is no way to avoid false signals. That’s trading – some position will be closed with loss and that is fine. Things I wrote before like checking trend on higher time frame should help you minimize that.
CONCLUSION
ATR is a great tool, which can help you earn some good dollars. I showed you how I use it – with GMMA and pivot points. If you trade with different set of tools, that is fine. You can join trailing stop loss with many other indicators and trading techniques. I hope that this article gave you some ideas how you can use ATR.
Bonus: more trade examples
EURJPY, 1h
Let’s start with a simple example. 1-hour chart, there is a confirmation from higher time frames that trend is up. You enter long when ATR changes from red to green and exit when it changes to negative.
MACD and RSI were positive during that time.
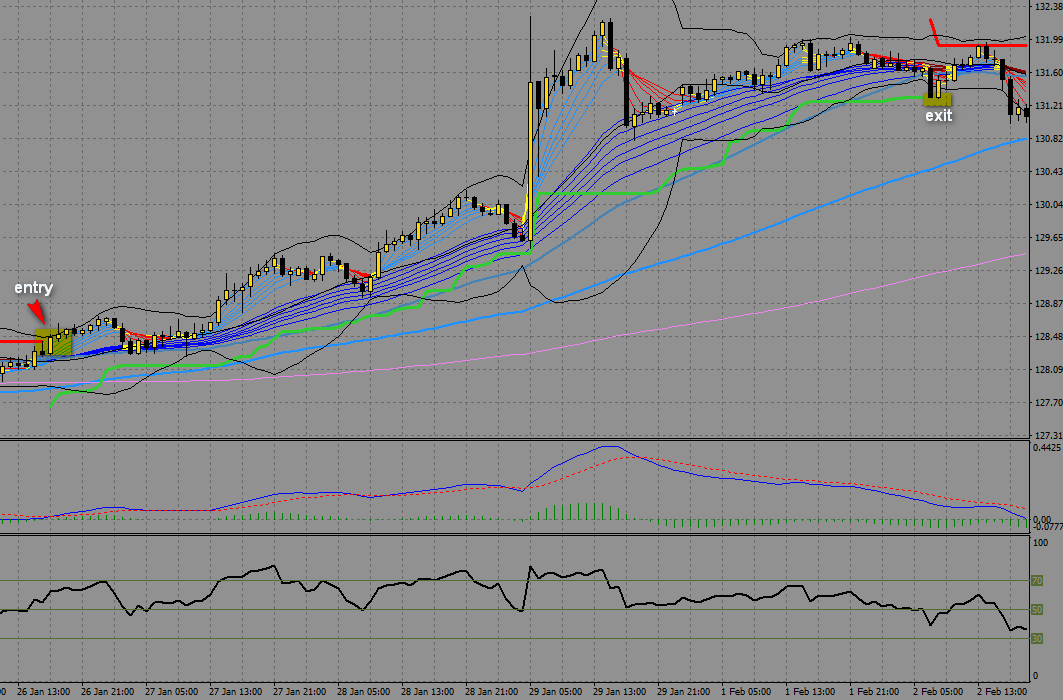
11.2. Over 300 pips in profit thanks to ATR stop
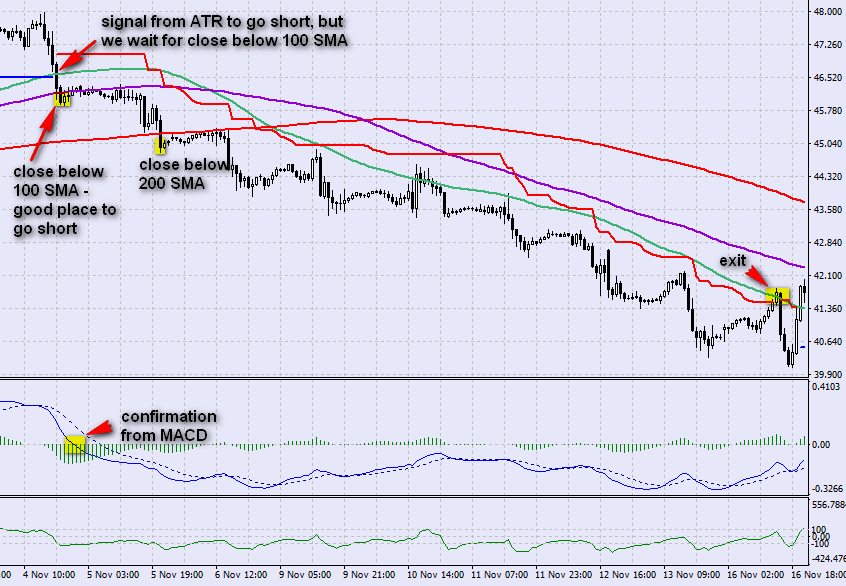
GBPJPY, 1h
This is a situation you will see rather often. After strong move, there is a possible change in trend direction. We saw a signal from ATR to go short, but it was tot early. The price was still above 100 SMA and 200 SMA. In that situations, I wait for break below 100 SMA (blue). You can see that first it acted as support and we could draw a support line based on recent low. When the price went below that level, it was clear that 100 SMA did not hold. It was a good place to go short.
Also, it was ok to wait for MACD to turn negative (below 0).

11.3. Sometimes it is good to wait for confirmation
GBPJPY, 1h
The main problem with ATR is when price moves in a range. This is a problem with any trading system or method. It is very important not to overtrade during range moves. If you are in doubt, check situation higher time frames.

11.4. Mxed signal in a range move
In this case over time it is clear that move is in range:

11.5. Range move marked with horizontal lines
You do not have to use GMMA. Some traders prefer to have a clear chart. That is fine. My good friend uses ATR with good results. He has on chart 100 SMA, Bollinger Bands, 21 DEMA and 55 DEMA. Let’s see some examples based on this setup.
SPX, 1-hour
This is a very good example of joining ATR with other signals. We are sure that trend is down (checked on higher time frames, also the price is below 100 SMA, MACD and RSI are negative). There was a signal from ATR to go short and we took it.
It was rather a strong move down. We had two possible ways of closing it. First was with ATR. So when ATR changed from red to green it was time to close (close #2 on chart). You can see that it was a little late.
If you have already a profitable position and want to protect your profit, you can exit earlier. In this case, there was a cross of DEMA averages. RSI closed above 50 line. As you can see, we saved few good pips.
The aim of this example is to show you that you can mix signals to enter and exit positions.
Notice that we did not open long position. There was a signal from ATR, but it was below 100 SMA.

11.6. We can enter and exit position not only based on signals from ATR
GBPJPY, 1-hour
On many times, when you are hunting for bigger trend move, it is ok to stick with ATR stop. On the chart below you can see that you were able to catch the whole move of almost 1400 pips. When you check DEMA, RSI or MACD you can see signals to go out. That is your decision:
– play it safe and close when you have signal from MACD/RSI/other. Later reenter trend
– play it for a long move – you want to catch as big move as possible

11.7. With ATR you can catch very strong moves
Settings for catching bigger trends
The last scenario shows a conflict. So far we were looking at examples of ATR and DEMA averages. We were hunting for a trend, but when something went wrong we were closing position.
If you want to catch bigger trends, my advice is to keep things simple. Switch DEMA to SMA. Why? DEMA is very responsive and works great when you want to react fast for a possible trend change.
SMA is slower, but it is a good indicator of support and resistance and during strong moves you want to watch these levels. So my suggestion is:
– 55 SMA
– 100 SMA
– 200 SMA
11.8. ATR and SMA averages as support/resistance
GBPAUD, 1-hour, when 100 and 200 SMA are close to each other
On the chart below you can see that sometimes it is ok to wait for another confirmation. We had a signal to go short from ATR, but the price was still above averages. You can see that 200 SMA was a support here. In this case, the best option was to wait for close below 200 SMA. You can see that there was such a close and this was the best place to go short.

11.9. Short trade with ATR and averages
WTI OIL, 1-hour, when there is a distance between 100 and 200 SMA
Another example that this is good to watch averages. There was a signal from ATR to go short, but it was still above 100 SMA and 200 SMA. The question is – go short on close below 100 SMA or 200 SMA like in the example above? It depends from distance between 100 and 200 SMA. In last example, we saw a case, when 100 and 200 were very near each other. It was best to wait for close below 200.
Here you can see that there is a rather large distance between 100 and 200. Also, after braking below 100 SMA, we can see that MACD turned negative. It was the best idea to go short after close below 100 SMA, with a tighter stop. Going short above 200 SMA isn’t that great idea, but in some situations, when we know that on higher timeframes trend is down, it is ok to take some risk.
11.10. Example of trade when there is a space between 100 and 200 SMA
GBPJPY, when ATR is far away from price
Not always everything goes according to a plan. Take a look at this example. We had a signal to go short and we took it. After a while, there was a pullback.
Take a look where ATR stop is.
It is rather far away. In most cases we would wait for a close above that line to exit with a loss. In this case, we have more information from 100 and 200 averages. After we went short, price pulled beck above 100 and 200. Also, MACD turned positive. It was better to take a smaller loss here than to wait for a close above ATR line.
It is impossible to show you each possible scenario. My point is, you can also take other signals than ATR to make decision about staying in the trade/closing the trade.

11.11. Example when ATR is far away from entry point. We can exit based on other signal


Dear Simon,
This is absolutely amazing and thought provoking. You brought me to tears of joy reading this post. Thanks so much for such a simple approach used in tackling this very important subject. I am deeply grateful. Everything here falls into place in eur/usd this week. Wish I had seen this earlier but there is always days ahead. Thanks a million