
Situation at Cyprus is not good for eur/usd. Downtrend is strong and bulls will have hard time to turn the situation around. In my opinion change of game will be when price will return above Ichimoku cloud and 1.31 level. For now I am short, mainly based on 4-hour chart:

On the S&P500 situation is different. Trend is up, but price bounced back from 138.2% Fibonacci extension line. You can see that clearly on weekly chart:
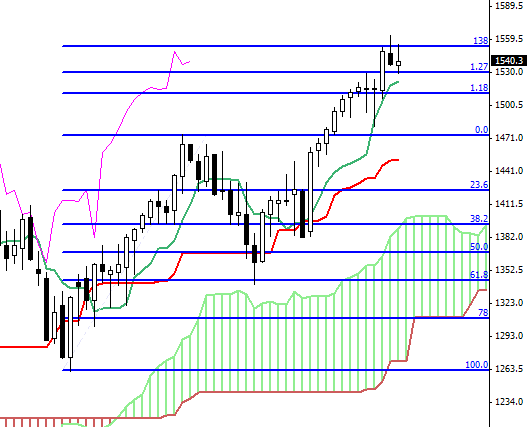
weekly sp&500 chart
On daily chart it’s not looking so great. Look at candles at the top. There is a candle in shape of shooting star and then a gap. For me it looks like a strong resistance:
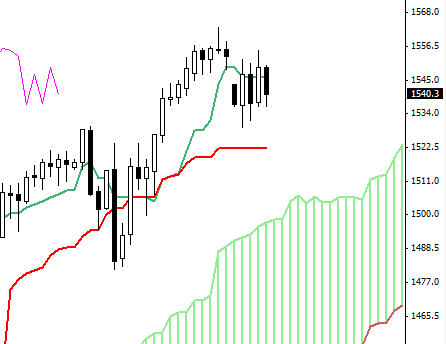
daily s&p500
Oh, one more interesting thing. Usd/jpy price is trapped inside the Kumo on 4-hour chart. That means that there is no clear direction of trend. Check closely like top and bottom of the cloud are working as support/resistance. If there will be break down, we may see more movement down:

4hour usd/jpy chart

