
Yes, it is this time of a year when we should take a look at yearly pivot points :).
Why yearly pivots?
As you know, I use mostly daily and weekly pivots, sometimes monthly. They work great when I am in a short or even longterm trade – I can check possible resistance and support lines and plan where to close my trades.
But it is good to remember that yearly pivot points can give us better longterm overview and some good targets. I know, I know… longterm trading, yearly pivots… not so sexy as High Frequency Trading and making millions overnight 😉
How to set up yearly pivot points in metatrader?
Simply use this pivot point indicator for mt4. In options select yearly, like so:

Still, if you are interested, here is my short overview of yearly Pivot Points.
EUR/USD
In last year eur/usd was moving up and down around yearly pivot line. It was a range move where top was right at M line, marked with rectangle (this is the line in the middle between pivot and R or S line):

This year we started below current pivot line. We can look at S lines as targets:

It looks like S1 is a very good target almost right at 1.000 level.
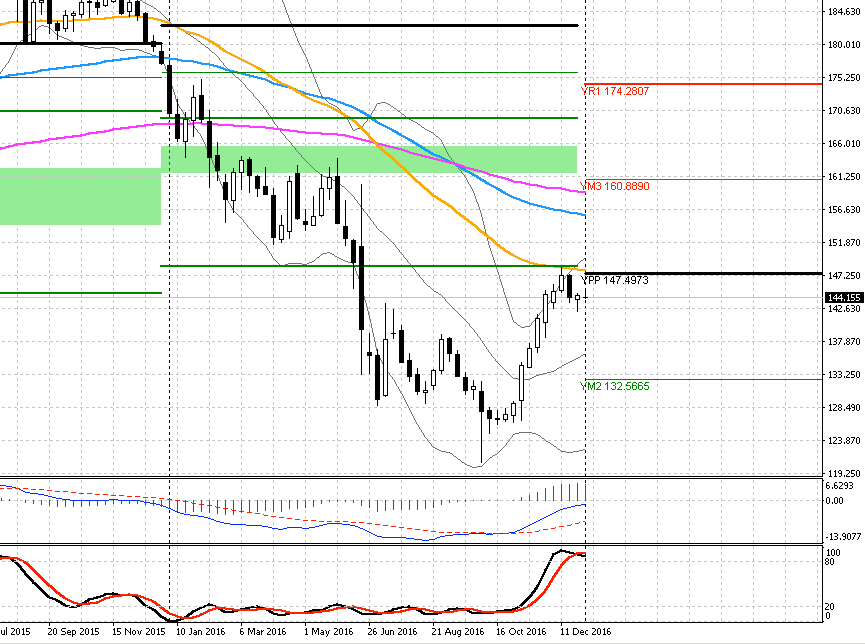
GBP/JPY
In 2016 GBP/JPY was in a downtrend. Recently, there was a strong bounce from 120 level which started a move up. Now we are right below yearly pivot line. There is a possibility that we may see GBP/JPY testing that pivot line. Question is, are buyers strong enough to push it above pivot line and these averages which also will be a resistance?
Weekly GBP/JPY with yearly pivot lines:
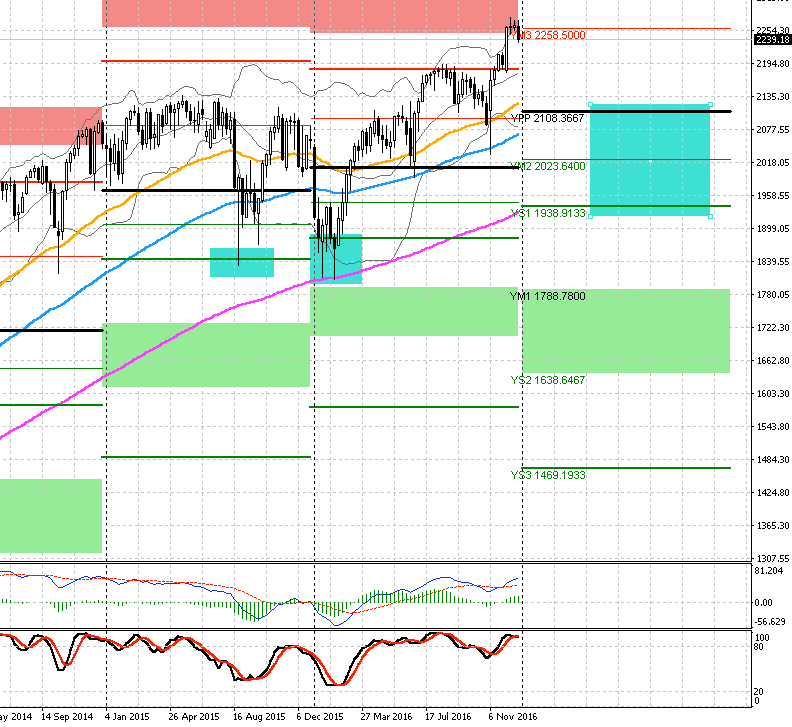
SPX
SPX is in a strong uptrend. You can read opinions that this bull market is almost over. Lets check the chart. Take a close look at last two years. During a correction price moved down to yearly S1 lines which were a strong support lines.
Now SPX started a year way above pivot line. If there will be a correction we can look at this whole area between S1 and pivot line as strong support area:
DAX
First a look at recent years:
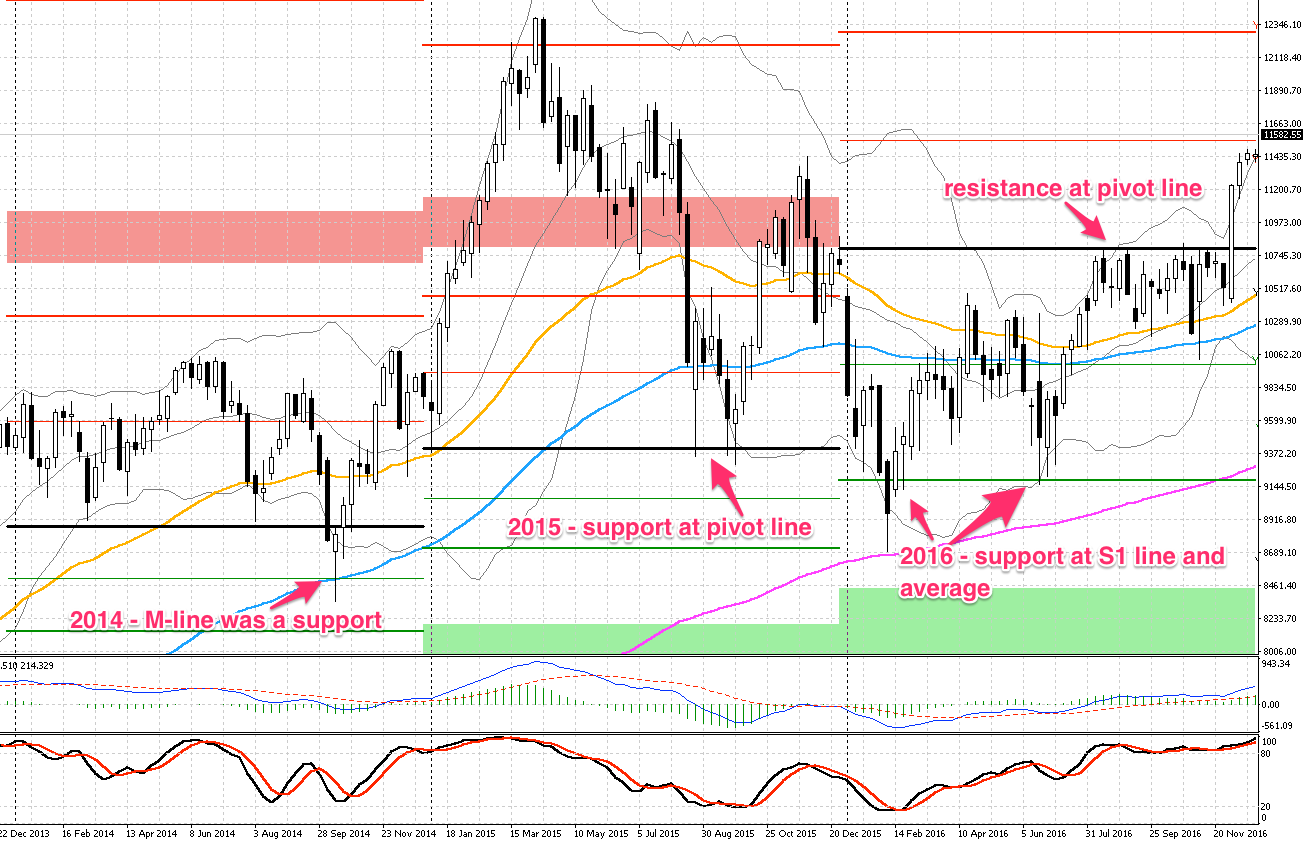
You can see that overall it was an uptrend. When there was a correction then it stopped usually at pivot line or M line.
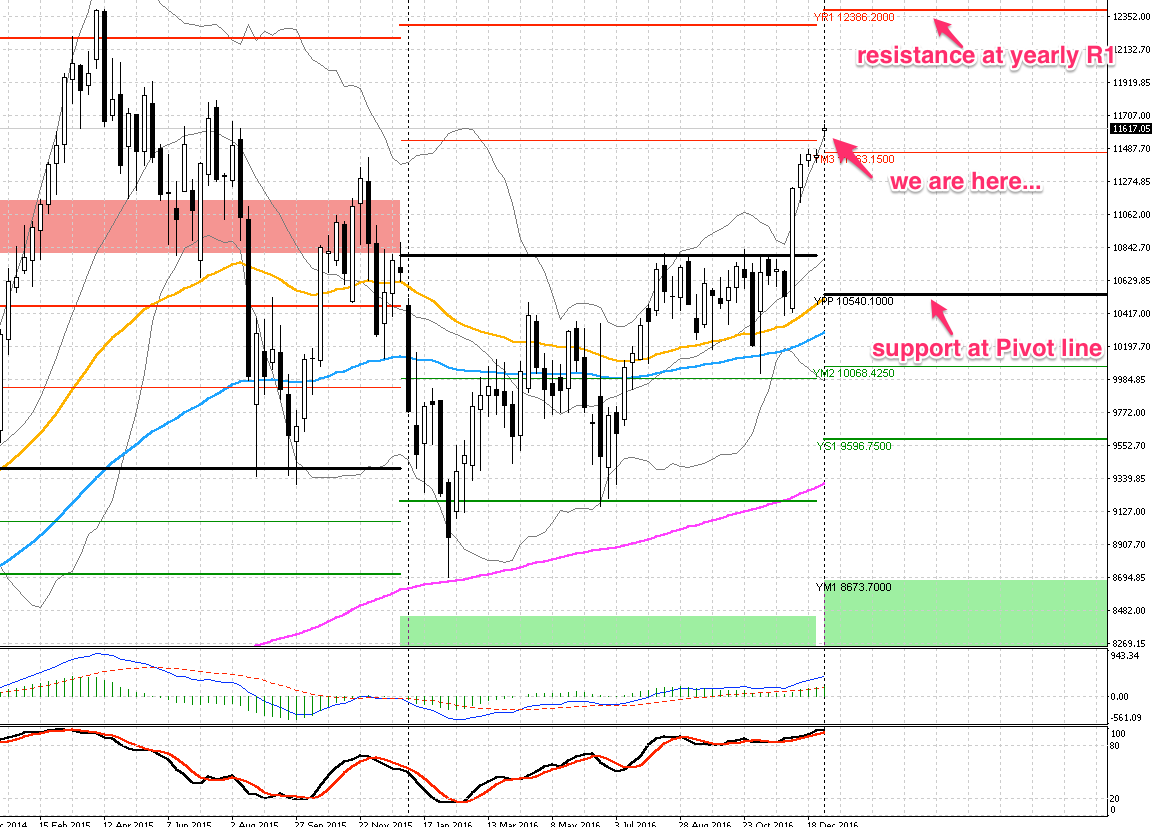
Now we started a year way above pivot line, almost in the middle. So we have support at Pivot line and resistance at R1 line:
OIL
Oil is interesting. It was oscillating around pivot line for most of the 2016. Now, it started a year almost in the middle, right at M line:

Similar to DAX, we have resistance at R1 and support at Pivot line. It looks like bulls are in charge for now so possible target for oil is 67$ (R1 line).
GBP/USD
It is pound so bears are in control. Last year support at S2 line did not hold. Now we started a year below pivot line. If there will be any correction up then this pivot line will work as resistance. If we continue down, we can look at yearly S1, M or S2 line. It is very close to psychological 1.00 level:

That’s it. Quick look at chart can give us some interesting insights. It is good to look at longer time frames and indicators like monthly or yearly pivots from time to time to see what is the current situation.


Meant to post this here:
Is there a way to eliminate the shaded areas, and instead just keep the YM1, YS2, YM4, YR2 as solid lines?
In addition, how can I eliminate the “M” (middle) lines? I’m looking to keep it clean, and just have YPP, YR1, YR2, YR3, YS1, YS2, YS3.
Cheers!
I think that you can eliminate M lines from settings.
About shades areas… there is no easy way. You can eliminate it by editing source code of this indicator. It will be faster thoe to search for other Pivot Points indicator (there are many of them).
Hello Simon
Can you add option to select camarilla pivot