
Remember – you can find a guide how to setup Fibonacci in your MetaTrader here.
Short info about Fibonacci trading and we go straight to the examples. You can read more about Fibonacci on my site, where I wrote few guides for beginners. I think that examples in this chapter are well described and you should understand fast what Fibonacci trading is really about.
If you do not know what higher high or lower low is, you will also find that information there.
Let’s get straight to the trading. When you trade with Fibonacci levels, you have to:
- find direction of trend
- wait and find ABC move with Fibonacci retracements
- open trade at correction and close at Fibonacci extension line (D point)
- that is why this is called ABCD pattern trading
First one is clear – we want to have better chances so we trade according to the trend from our time frame. I try not to complicate this. I simply look at price action and sequence of highs and lows. I also use moving average – in most cases this will be 33 and 55 expotential/ linear weighted moving average. If price is above, then trend is up, if price is below then trend is down. Remember, you won’t be always correct about trend direction, but you need some simple system so you can focus on trades.
OK, we defined trend direction. Now we look for ABC move. There are two scenarios you can execute.
Scenario 1 – safer
In this scenario we wait for move ABC to finish, but we do not enter a trade. When the move from C to D starts, we are still waiting. Our entry point will be break above high from swing A-B. Minus of this method is that on many times price will move rapidly through this level and it will be hard to open a position. Also, there are many traps here like false breakouts.
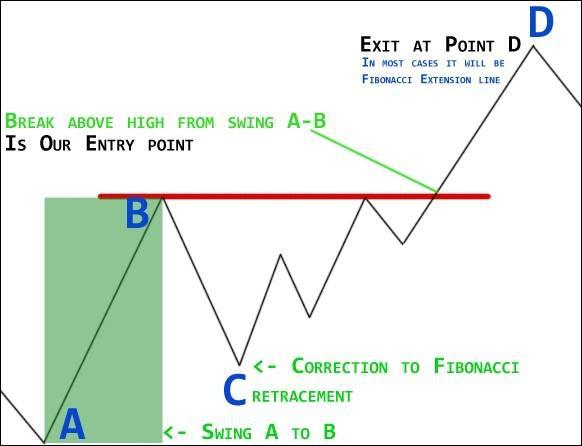
4.1 Fibonacci trading – safer scenario
Scenario 2 – trying to catch bigger part of move
Entry here is somewhere between B and C AFTER correction ended. Still, you have to use some sort of verification signal.
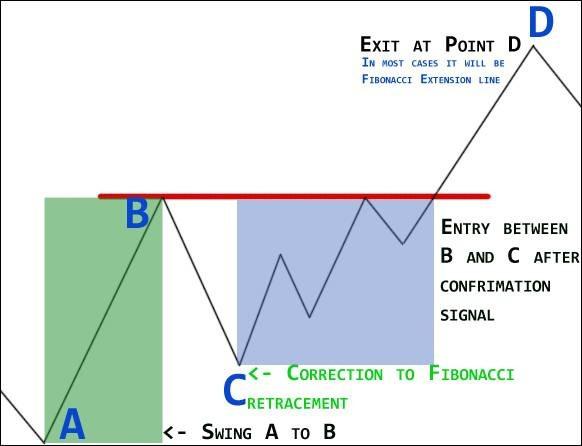
4.2 Fibonacci trading – entry between B and C
Some traders play a third scenario which is a trade between C and B. So after correction to fibonacci retracement you open a trade and close it when price reaches near recent high (B).
I most often use scenarion 2. With scenario 1 on many times I was too late in trade. I am willing to risk little more to get more part of move.
With that knowledge, lets check some trade examples.
EURUSD, 30m chart
Price is holding above 33 average, so I was looking for long opportunities. After shallow correction price moved up. We had also a signal from CCI 33, which crossed above 100 level. It was a good place to enter. Move was strong, and my exit target was 161.8% extension line.

4.3. Entry example based on CCI
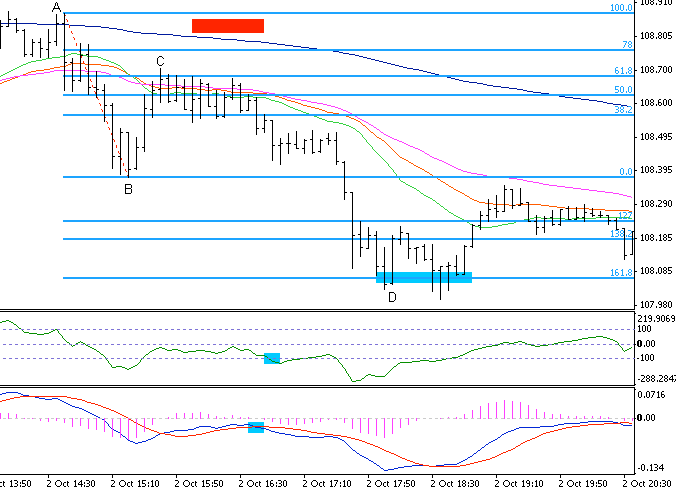
USDJPY, 5m chart

4.4. ABC move, failed to move above B point
This trade ended with stop loss. It is not always happening fast – AB, correction to C, move to D. Sometimes correction takes some time. Then we can draw trend lines. It looked that correction ended at 61.8% retracement line. Later we had a breakout above first trend line. We also had a signal from 33 CCI (close above 100 level). First it looked nice, but then price reversed and moved down. I put stop loss below 61.8% retracement line. I was stopped out, but loss was not that big. That is why money management is so important.
USDJPY, 15m chart

4.5. Fibonacci trading with multiple averages
Sometimes you can use more than one average to plot resistance and support areas. In this case thanks to MMA (multiple moving averages), it was clear that trend is down. We got also confirmation from 61.8 and 78 retracement lines. In that case, you would go short after a break below green average – before it acted as support to later switch and act as resistance.
USDJPY, 15m chart

4.6. Example of resistance at retracement line and moving average
Similar example. Thanks to MMAs we have a clear picture of the current trend. Price retraced to 50% and green average, after that the move down continued. As you can see, here you could open a trade at the break below recent low and it worked great.
EURUSD, 1m chart
In the morning there was a great setup – move up, correction down to 61.8% retracement and 55 simple moving average and then move up to the extension line. We got signal from MACD. I like situations like this one because price can find support from two different sources – Fibonacci retracement and moving average.

4.7. End of correction at 61.8% and 55 SMA
EURUSD, 1m chart
This trade opportunity was after some sideway movement. Entry point was the close above 0% line (B point). As you can see, this was a pretty strong (a little choppy) move way up to the 261.8% extension line:

4.8. ABCD move in a choppy market
It was hard here to spot ABC move, but you can see that it worked great and move ended at 261.8% extension.
USDJPY, 5m chart
4.9. Short trade which ended at 161.8% extension
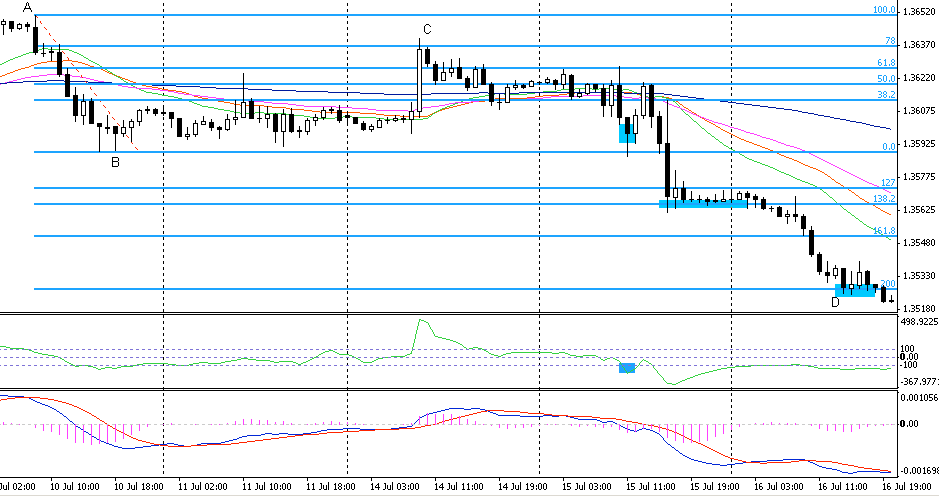
Price was under 200 moving average. We could easily spot ABC move. After that, move down slowly developed and we had signals from CCI and MACD. Best place for stop loss was above 200 average and above 78% retracement. Move down was strong, with a short pause at 138.2% extension and final stop at 161.8% extension. As always, half of the position was closed at 138.2%, and rest at 161.8%.
USDJPY, 5m chart

4.10. Short trade which ended at 161.8% extension
USDJPY is above 200 moving average, and we have an uptrend in place (looking at 21, 33 and 55 averages). After a small correction to the 38.2% retracement line move continue up and we had signals from MACD and CCI. Half of position is closed at 138.2% extension, and we move stop loss on the other half. Where? To the entry level, that way if we are stopped out, we only scratch that position. Later we got stopped out on second half of position without a loss.
USDJPY, 5m chart

4.11. Short trade which ended at 161.8% extension
We have here a downtrend on 5 minutes USDJPY and correction to the 61.8% retracement line. After that we have a move down and signals from MACD and CCI. Best place for stop loss is above 78% retracement line. Price moves down to the D point which is 138.2% extension line. We have a double bottom here and move down ends.
EURJPY, 1h chart

4.12. Short trade which ended at 161.8% extension
You can use this technique on other time frames. In this example, we have 1-hour chart of EURJPY. Price is below 200 moving average, and we have a downtrend. It all should look familiar to you. After a move down we’ve got signals from CCI and MACD. There was a pause at 161.8% extension line, but eventually, price moved down to the 200% extension. The timeframe is different, but all the rules are the same.
Oil, 15m chart

4.13. Flat market example – no Fibonacci trade here
Sometimes there is simply no trade and no setup. In this case, oil was moving in a narrow range. You could try to find ABC moves, but in which direction? When I see a situation like this, I draw support and resistance lines (on chart) and wait for a break up or down. In markets like this, you can lose a lot so it is great to learn that is wise to wait it out.
Oil, 15m chart

4.14. Short opened between B and C
Another example of short trade on oil (15 min chart). We have clear downtrend and we are below 200 average. We have a signal from CCI and we go short. Move ended at 138.2% extension. Look how fast price moved down after break below 0% line. That is why I try to open position between 0% and 61.8%. This way I can set stop loss not so far, and be in the game when the strong move occurs.
EURUSD, 1h chart

4.15. Short opened between B and C
Trading with Fibonacci works great on any time frame. You can use it on higher time frames to trade less and catch bigger moves. On EURUSD we had a strong down trend. On some trading days, you have to simply wait and execute the plan. Just like on 1-hour chart above.
I wanted to show you that easy setup, when price broke below support, was enough. One thing is interesting. Move down was strong, but stopped at 200% extension line (what is very common when 161.8% fails as support).
SPX, 5m chart
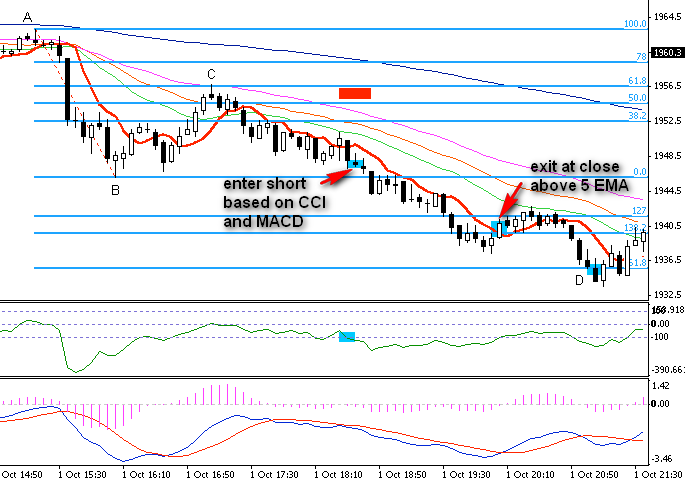
4.16. 5 EMA (red) as simple trailing stop level
Sometimes you may not know if the best place to close is 127% or 138.2% extension? Or maybe wait it out to the 161.8%? You can try to add 5 expotential/linear moving average (red on chart) and close first half when there is a price close above that average. When there will be strong move right to the 161.8% extension or even 200% you have a good chance to catch most of that move. It takes some practice to use that technique. I simply stick to the 138.2% and 161.8% extensions as targets, but when move is rapid, I go for 5 MA.
USDJPY, 1h chart
4.17. Strong move down to the 200% extension
Sometimes when you do not expect this, 200% works as a target like in this example. There was a stop at 138.2% extension, but after that price moved down to the 200% extension. It is a good idea to test different techniques to catch these kinds of moves. For example, you may try to add 5 moving average as I wrote before. You may also try to use trailing stop loss so you can be in trade as long as possible. You can read about trailing stop loss later.
Fibonacci trading on higher timeframes
Fibonacci can be very accurate on 1-minute or 5-minute charts, but also on longer time frames it works great. Basically, you can use it almost the same way as on lower time frames. The plan is simple, you can know it already:
- spot ABC move
- wait for correction to retracement line
- when correction ends, go long (when there is a signal)
- close position at extension line
- you can close position before sell-off, and take nice profit from the table
- sometimes trend is stronger than you thought, you close position at extension line, but there is another strong move (wave)
- use lower time frame to try to exit
- use trailing stop loss
- define another exit signal (like in next examples)
- entry point – after ABC move is completed, after signal from MACD
- stop loss below previous low
- exit when price closes below 33 expotential moving average
- entry point – after ABC move is completed, after signal from MACD
- stop loss below previous low
- exit when price closes below volatility stop loss line
Pros and cons are:
It depends from you – which system are you looking for and how good will you master it. I use this strategy all the time (not exclusive, I mix it with other strategies – depends from the chart).
It looks like this – I scan charts every week looking for good trades. When there is a correction, I draw Fibonacci retracement and leave it on the chart. Next week I check if there is a signal. That’s it. When there is a signal, I open a position and set take profit target (usually 138.2% or 161.8%) and stop loss (bellow 78% retracement line). I leave this transaction and only do a check up every week.
In most cases price will stop at 138.2% or 161.8% extension line. Stop, that does not mean that it won’t go further. But for this system it is ok – you can set clearly exit points. The problem is with entry. You have to have a good entry system. I have best results with a combination of Fibo retracement lines and resistance/support lines.
UTX stocks, monthly chart
This example should be clear to you by now. Move A – B, correction to C (78% retracement line). Bulls are not quite strong to start a rally so triangle is formed. Finally, bulls managed to breakout from triangle and rally started. At 161.8% extension line price stopped and there was small correction. Not for long, bulls came back and attacked 200% extension line at 120$ – this is our D point. Once again, when 161.8% did not stop price, then it is possible that it will stop at 200% extension (if not, the next one is 238.2%).
You can clearly see that drawing resistance and support lines gave as a good entry point. Stop loss would be placed below support line.

4.18. Strong move after break from triangle
Microsoft stocks, weekly chart
This is a nice setup. Green line is a trend line. From move AB we draw retracement and extension lines. Price moves back to 50%, from failed breakout we can draw resistance line. Finally, price managed to breakout above two red lines and rally continue. Price stopped at 161.8% extension and there is some sell-off, but bulls returned. What I like most about this setup is that when we have strong trend (green line), then our chances are good to catch next waves.
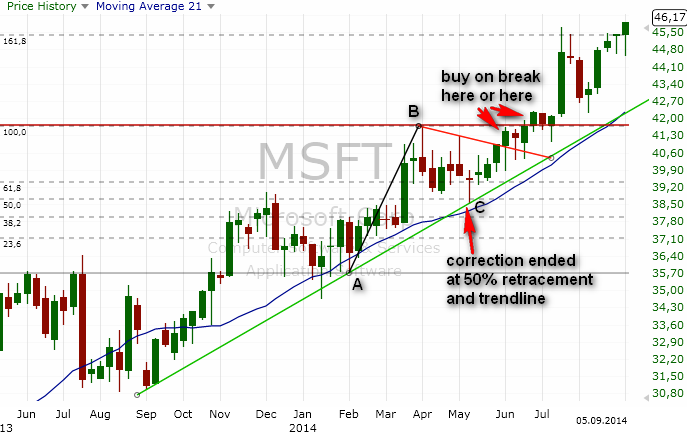
4.19. Example of correction which edned at trendline
Adobe stocks, weekly chart

4.20. Adobe trade on weekly chart with Fibonacci and MACD
Not always entry signals will be correct. In this case, first signal from MACD to go long was false. There was a breakout attempt, but it failed. Later there was another signal and it was a move to the 138.2% extension line. In reality, after first signal, we would go long and set stop loss below 61.8% retracement line. There is no 100% correct signals and some trades will be wrong. But sometimes it is good not to overtrade it and follow a plan.
LVS stocks, monthly chart

A good example that you can look for Fibo trades on a monthly charts. When you look first at the chart, AB move is hard to spot, because trend is down. Later averages crossed and we saw a positive order (21 above 33, 33 above 55). We also had a signal from MACD. In this moment ABC made sense and we could try to go long. This was a nice move up to the 161.8% extension line.
Microsoft stocks, monthly chart
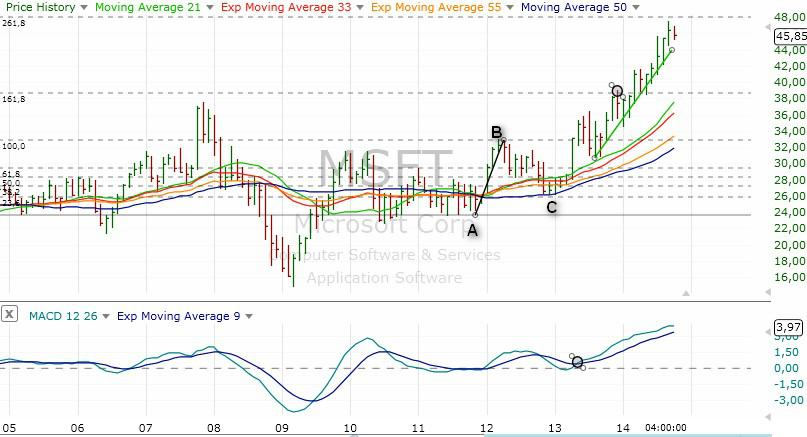
4.22. Strong move from small AB leg
Sometimes we have strong moves from small vawes. On this monthly Microsoft chart we waited for situation to clarify. Eventually averages crossed and were positivie, we also had a signal from MACD. You can see that price only stopped for a short time at 161.8% extension, and later it continued to move up.
Pepsi stocks, monthly chart

4.23. Strong move from small AB leg
It is possible to invest in very long term. On this Pepsi chart move AB started in 2003 and ended in 2008. Then we saw a correction move to 78% retracement line below 50$ (retracement on chart are flipped over). Bulls came back here and we saw a signal from MACD around 65$. Pepsi is still going up with possible exit places at extensions such as 138.2% and 161.8%.
It is important to train your eye to spot things like this one.
LLTC stocks, weekly chart

4.24. Move up to the 200% extension
With positive averages it is clear that trend is up. We can easily spot some ABC moves. After signal from MACD to go long LLTC went up to the 161.8% extension. This was not an end and there was another move up to the 200% extension line.
You never know in advance where the move will end. You can:
MDT stocks, weekly chart

4.25. Averages as a stop level during a strong move
It did not expect such a strong move up. We saw an ABC move with correction to the 61.8% retracement. Later there was a signal from MACD. Ok, with previous scenarios we would like to close at 161.8% extension or eventually at next one extension. But this move is so strong that we are leaving a lot of money on the table in that case. You can build your trading plan such as:
Sometimes it will work great, and sometimes not. It is up to you to test that in practice and depends strongly from price behaviour.
PCLN stocks, weekly chart
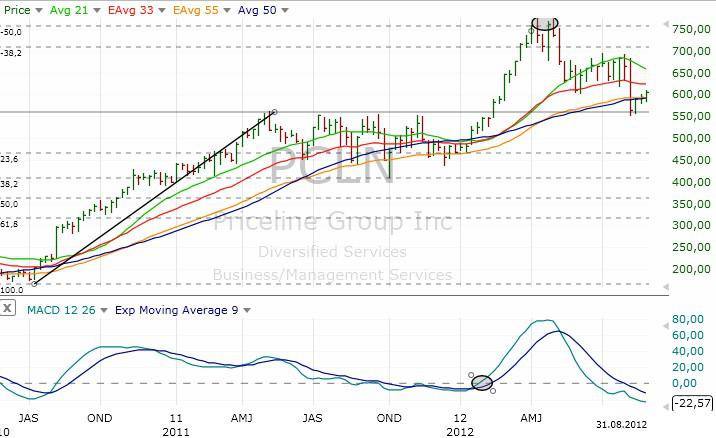
4.26. Average is away from price. It is better in this case to exit at extension
When you see that moving average is far away from price then it might be better to simply exit at the extension line. In this case, 21 average was almost 100$ away. It was better to exti at extension or add shorter average.
YUM stocks, weekly chart
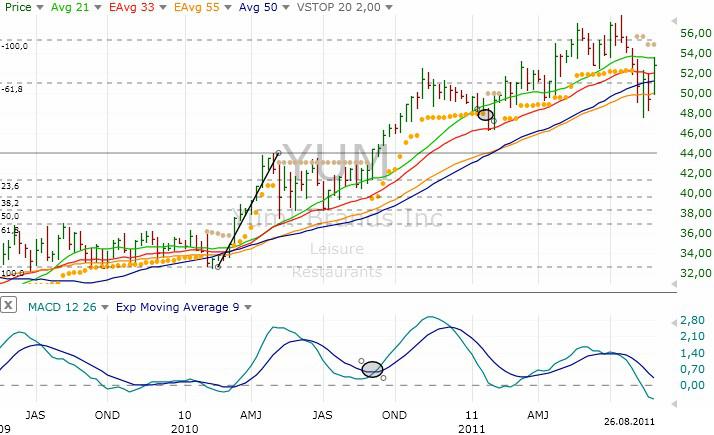
4.27. ATR trailing stop loss as an exit point
You can also use volatility stop loss (sometimes called ATR trailing stop loss). So your trading plan would be like:
Some traders use volatility stop with good results. It is important to calibrate this with chart. I use rather moving averages and trend lines, but you can experiment with volatility stop.
Apple stocks, weekly chart
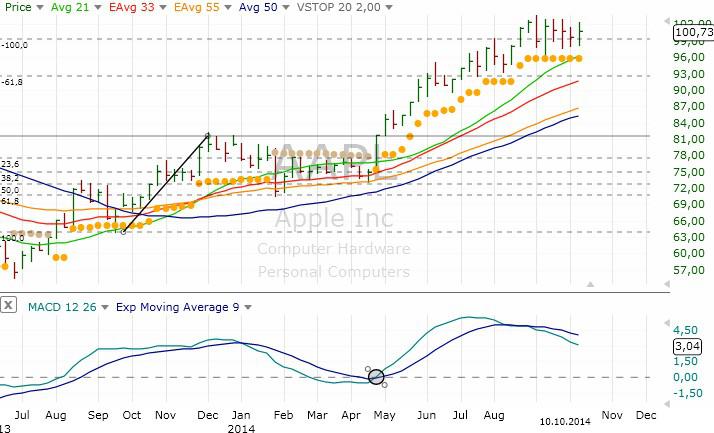
4.28. Example how ATR let us to control exit level during a strong move
On this Apple chart, after buy signal from MACD, move up is strong. With volatility stop, we would be still in the trade. We never know where move will end, so this is a good alternative to try to stay as long as it is possible.
Coca-Cola stocks, weekly chart, part 1
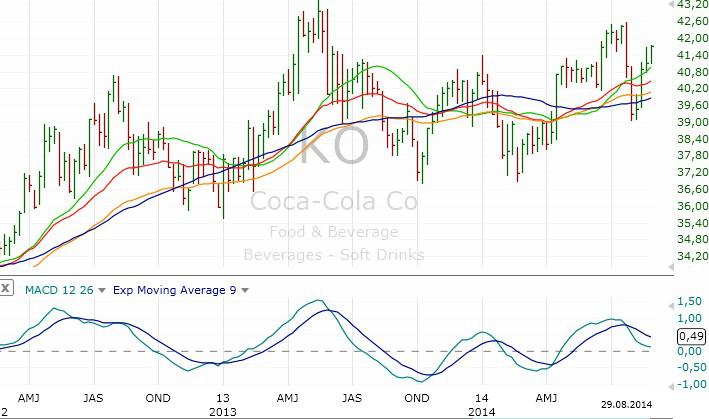
4.29. Range move on weekly timeframe
One more thing about long term investing. Even on longer time frames it maybe hard to find ABC moves and recognize current situation. Like this weekly Coca-Cola chart. Looks like uptrend, but later it is in range. Is it a good idea to go long? If you are not sure, check other time frames.
Check the next chart:
Coca-Cola stocks, monthly chart, part 2

4.30. When we check the same stock from
When we check the same stock, but on monthly chart, we have a better picture.This is a long ABC pattern, with signal to go long from MACD and nice long breakout.
Even when you decide to trade let’s say on weekly charts, check other time frames.


